一、背景
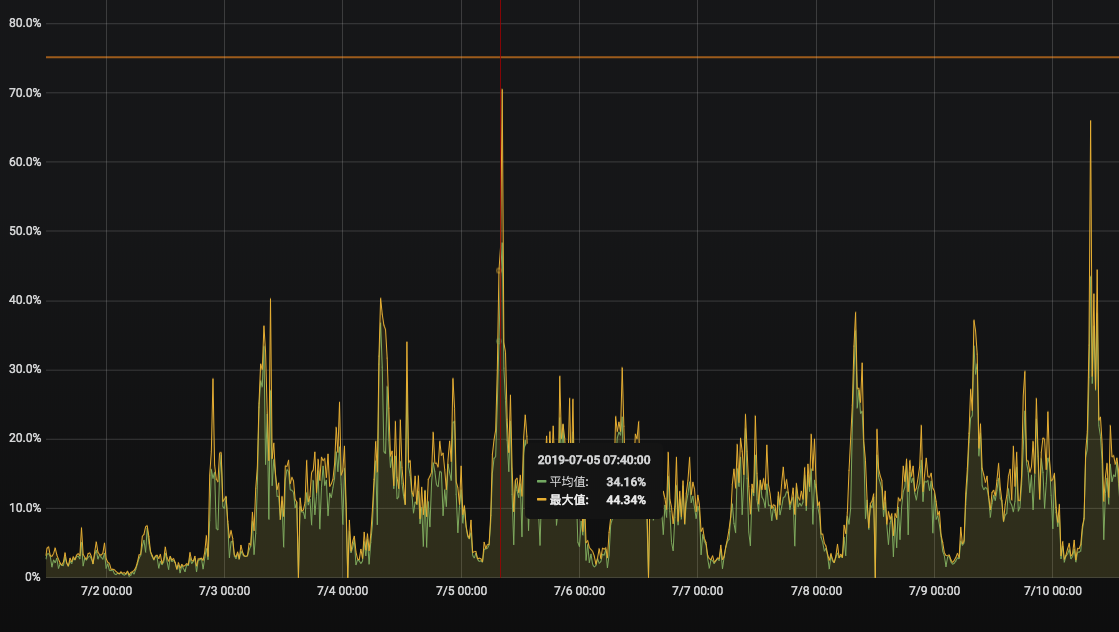
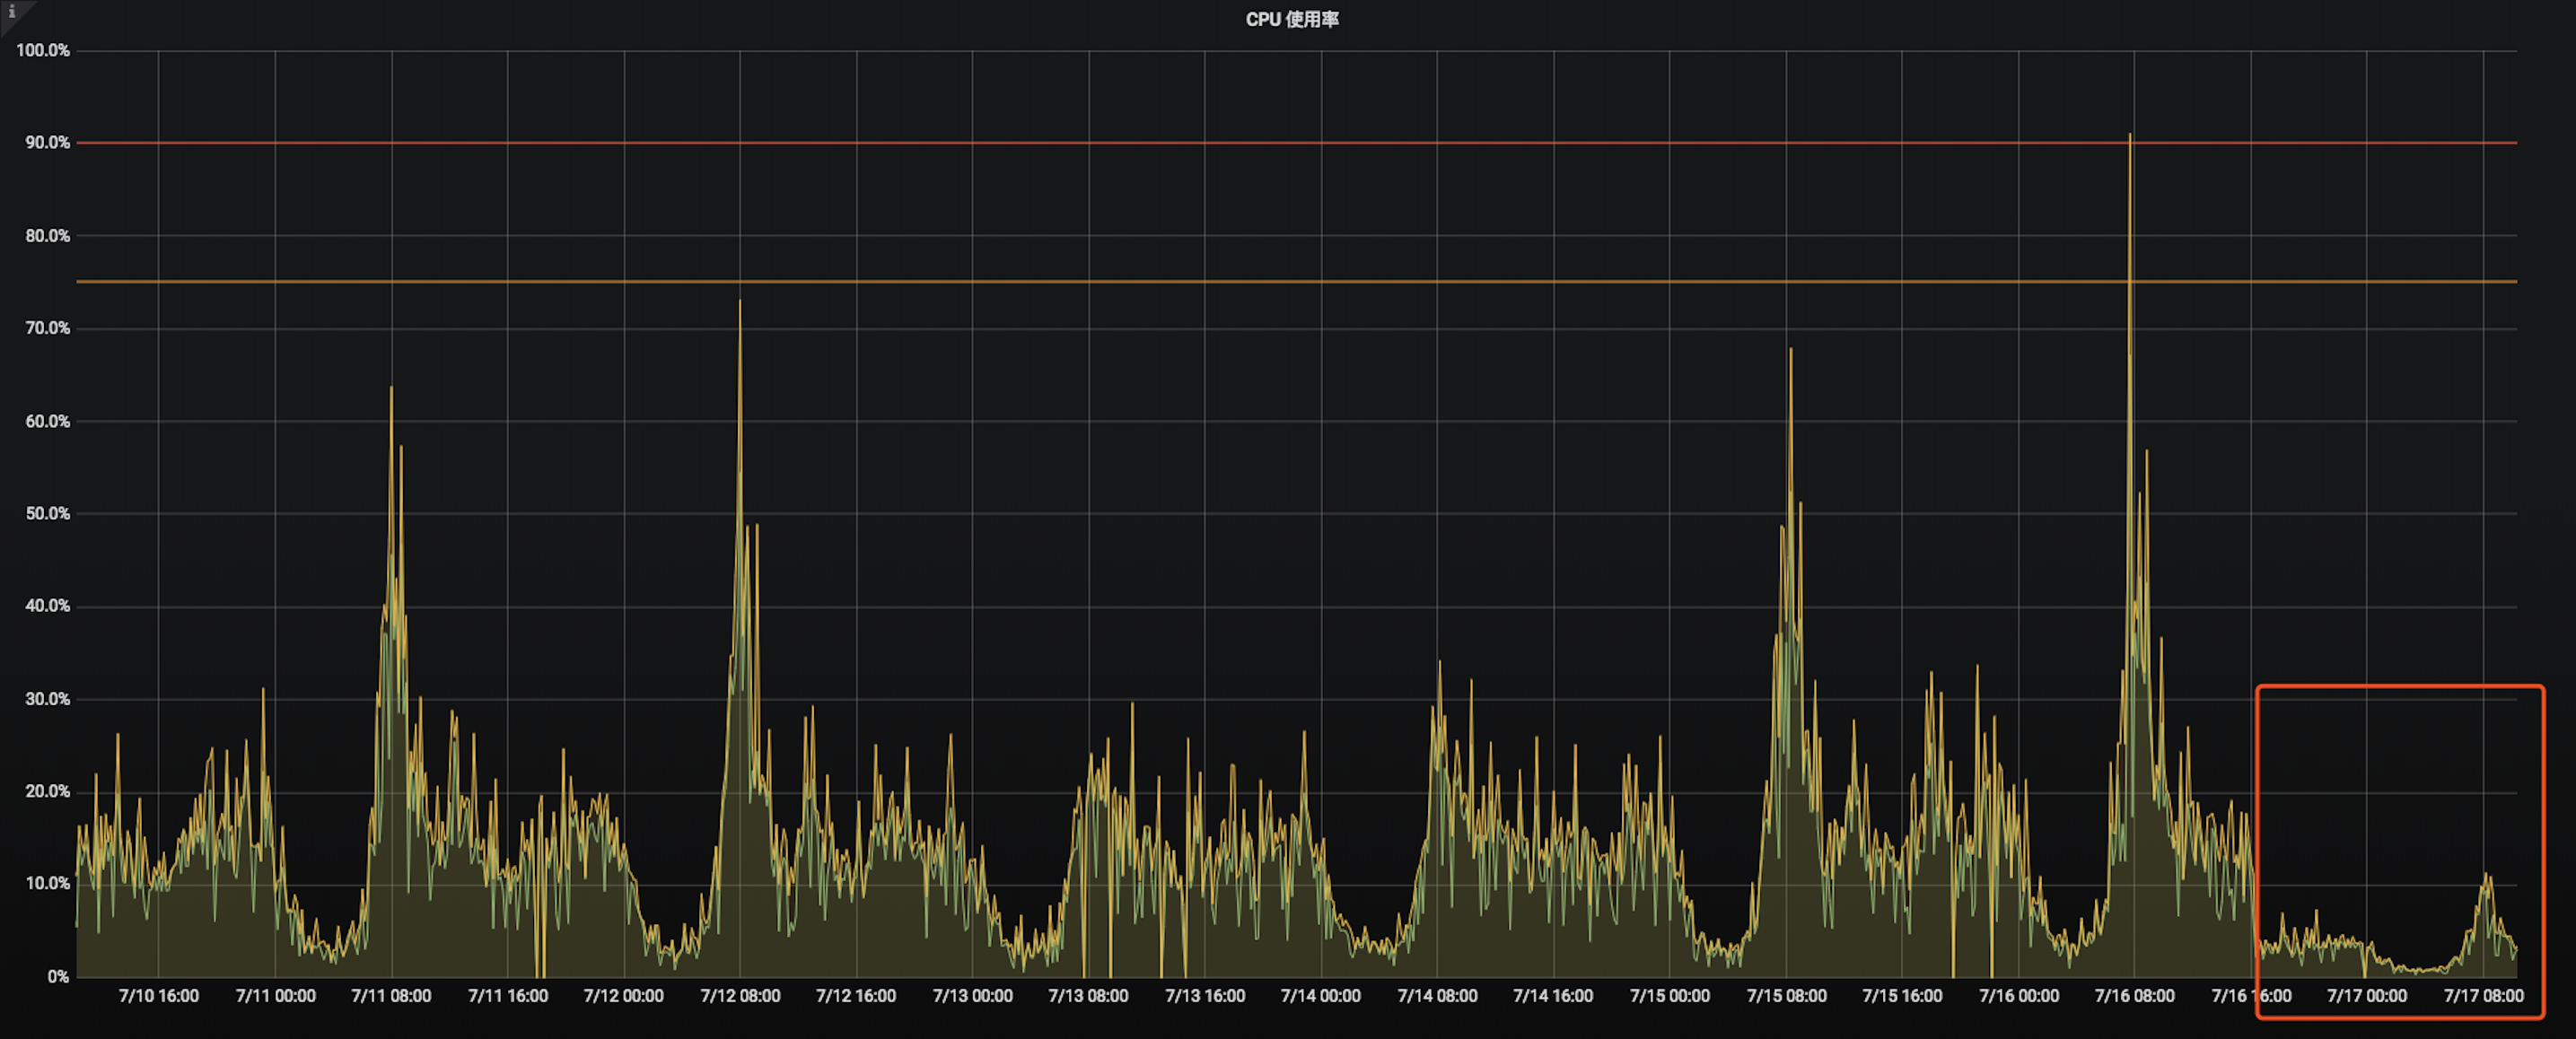
话不多说,先上图,这是得到 App 静态资源更新服务的 CPU 使用率监控,可以看到 7 月 2 号到 7 月 3 号后,cpu 使用率发生了爆涨,在八点的早高峰和下午六点的晚高峰,几乎可以把 cpu 打满。发现问题当机立断,升级配置将 2 核 4g 升级至 4 核 8g,先保证服务稳定,我们再继续查问题。
下图是升级配置后的截图,所以看到的图已经温柔很多了,本人当时看到监控的时候,所有波峰都是打在红线以上的,虽然还没有引起报警,但是默默掏出小本本记下找时间查问题。
因为有很明显的发生变化的时间点,直接能找到这一次的改动,经过一点点的代码级 review,并没有发现变动的代码上有什么问题。作为一个小前端没遇到过这种问题呀,毫无头绪的我,把救世主锁定在了火焰图身上,想看一看到底什么地方耗时长到底 cpu 占用在了什么东西上。
二、火焰图
于是怎么生成火焰图成了我最大的难题,开始 Google 搜索,“如何生成火焰图” ,“node 火焰图”,“node cpu profiler”, “node flamegraph”。看来看去所有文章千篇一律,95%以上的文章都是如下解决方案。
方案一:Linux perf
参考文章:nodejs 调试指南 perf + FlameGraph
Linux 自带的系统性能分析工具,一堆功能我就不多说了,有兴趣的自己去看nodejs 调试指南打开书的第一页。因为使用的局限性不是 Linux 的我,第一步 apt install linux-tools-common 都安不上,如果还要跑在虚拟机什么的上面是不是太麻烦了,方案一卒。
方案二:Node.js 自带的分析工具
参考文章:易于分析的 Node.js 应用程序 | Node.js
Node.js4.4.0 开始,node 本身就可以记录进程中 V8 引擎的性能信息(profiler),只需要在启动的时候加上参数–prof。
Node 自带的分析工具:
- 启动应用的时候,node 需要带上—-prof 参数
- 然后就会将性能相关信息收集到 node 运行目录下生成 isolate-xxxxxxxxxxxxx-v8.log 文件
- npm 有一个包可以方便的直接将 isolate 文件转换成,html 形式的火焰图GitHub - mapbox/flamebearer: Blazing fast flame graph tool for V8 and Node
完成以上步骤火焰图果不其然的跑了出来
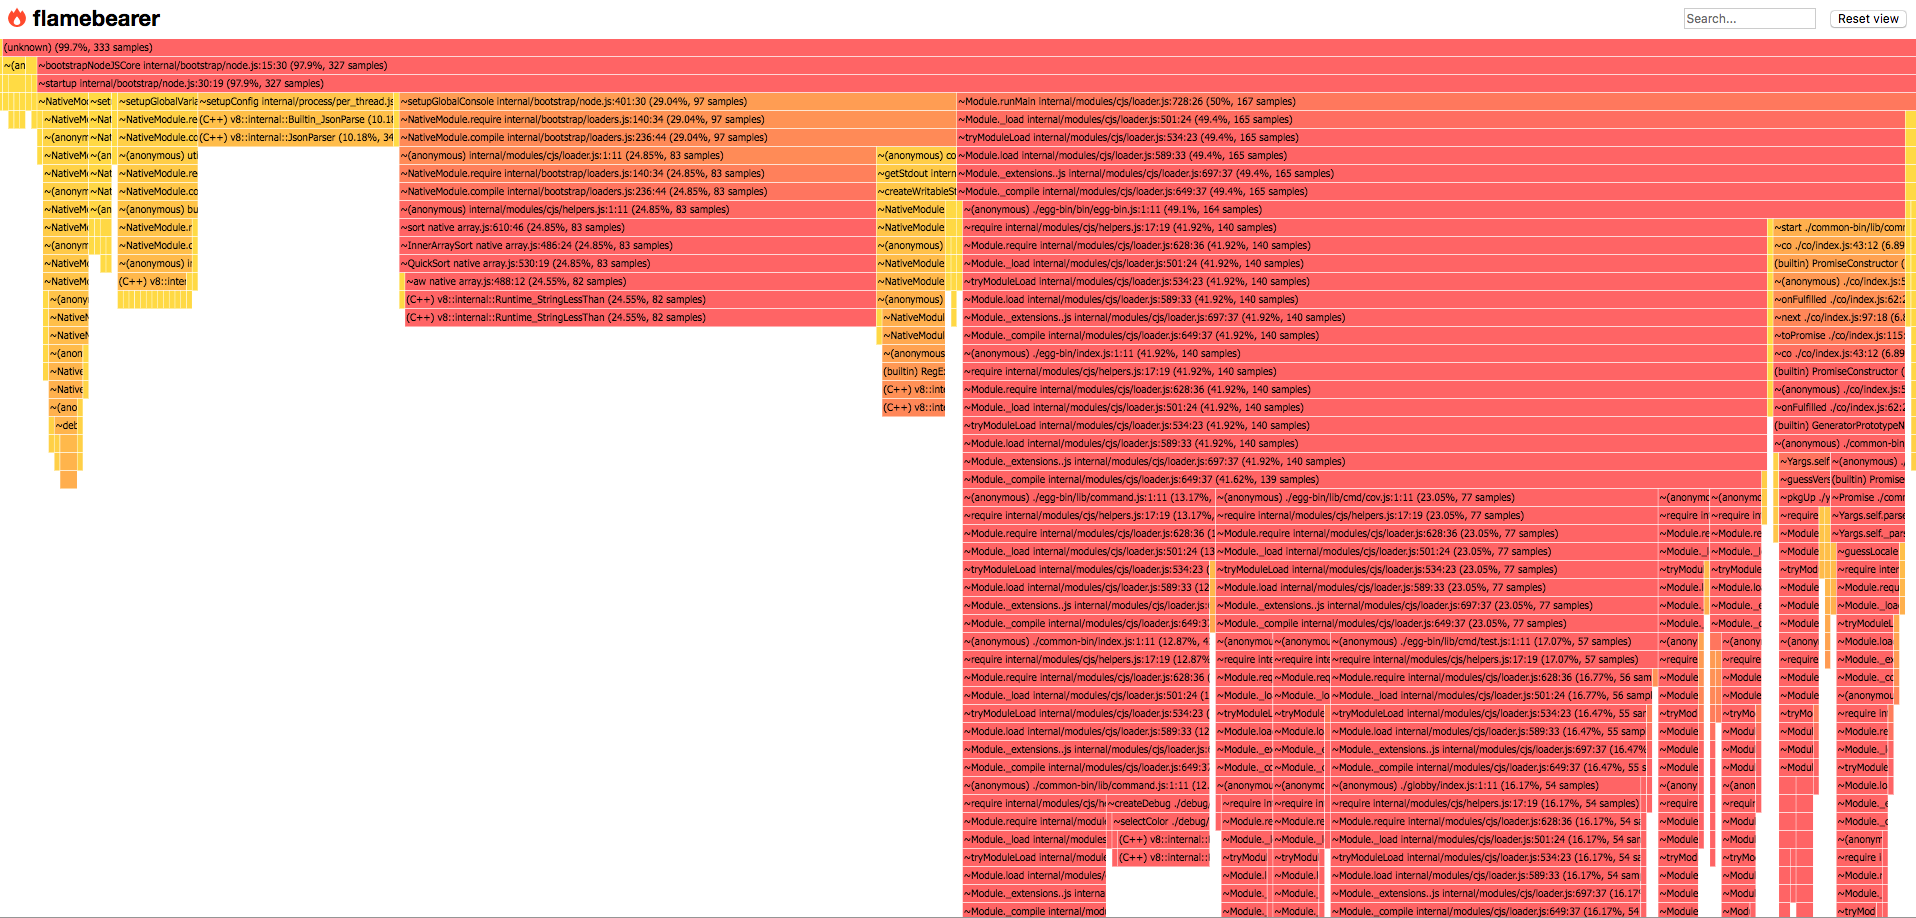
可是仔细一看好像不是那么一回事,因为项目用的是 egg 框架,火焰图里的全部信息都是 egg 启动的东西啊,我长达五分钟的接口压测,一点都没有体现在火焰图上,一拍脑袋,想起来我用 node –prof 的形式收集到的性能数据都是 egg 主进程上的东西,而我们所有的接口全都打到了 egg worker 上去了,一点都没有收集到。顺便提一句 egg 提供了单进程模式RFC 增加单进程启动模式 · Issue #3180 · eggjs/egg · GitHub但还只是实验阶段。方案二又卒,好在我起码看到了一张图。
方案三:使用 Dtrace 收集性能数据
直接查到应用的 pid 直接对 pid 进行收集,然后也可以将收集到的数据制成火焰图,具体操作就不做赘述了,最后跑出来的图如下,
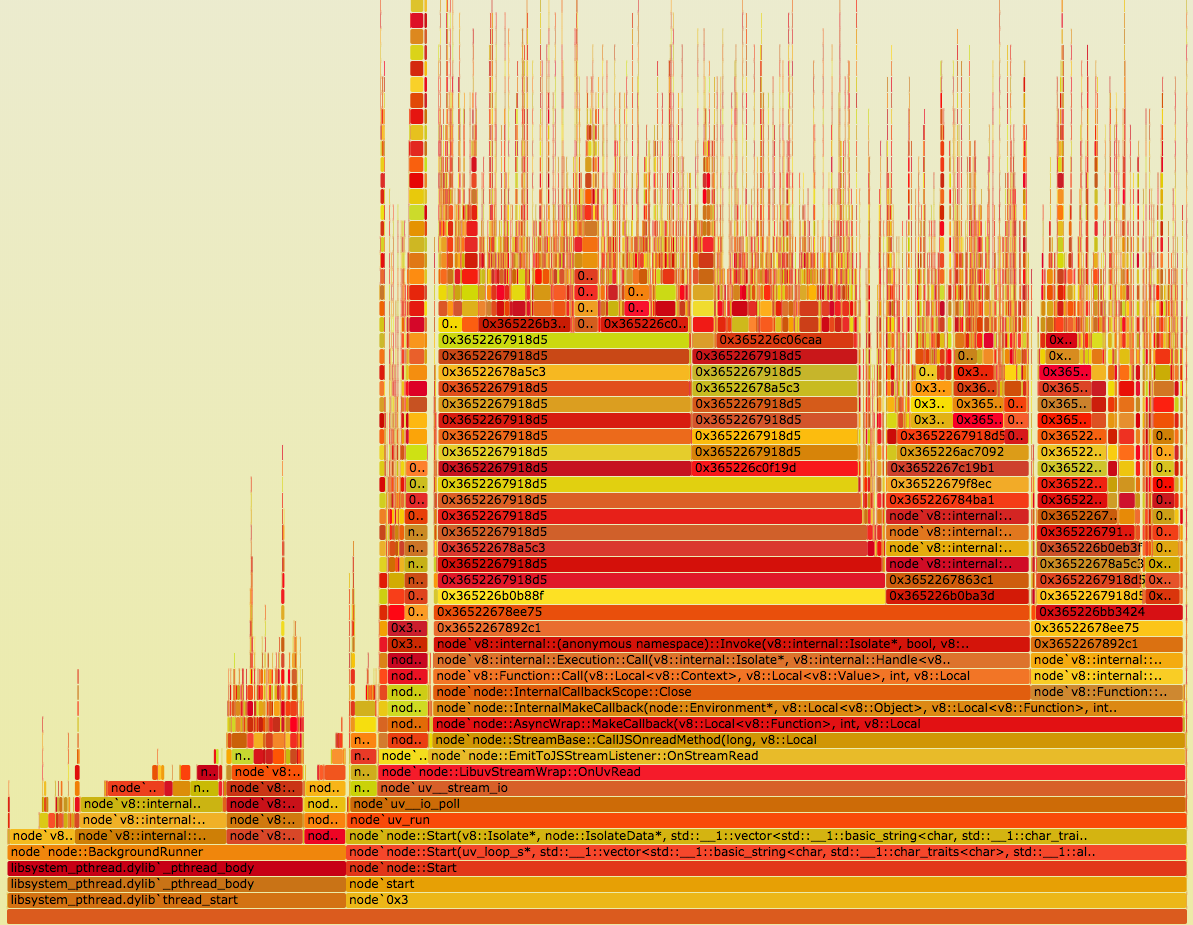
全部是一些 v8 底层的东西,好像也没有我想要看的内容呀,方案三卒。
好了以上就是我 Google 出来的各种方案在我一一踩坑后全部以失败告终,其实也还有一些更简单的方案,例如直接接入 alinode 用阿里云的平台就好,一方面该项目没有接入阿里云,刚好用的 node 镜像又不是 ali 的,另一方面,如果可以在开发环境查出问题,不希望再通过上线去查问题。
方案四:v8-profiler
Node.js 是基于 V8 引擎的,V8 暴露了一些 profiler API,我们可以通过 v8-profiler 收集一些运行时的 CPU 和内存数据。
在安装 v8-profiler 的时候遇到了一些问题总是安装失败,并且得不到解决。不过好在有大神基于 v8-profiler 发布了 v8-profiler-node8,下面是 v8-profiler-node8 的一段描述。
Based on v8-profiler-node8@5.7.0, Solved the v8-profiler segment fault error in node-v8.x.
v8-profiler-node8 provides node bindings for the v8 profiler and integration with node-inspector
收集数据:
简单的 npm install v8-profiler-node8 后,开始收集 CPU profile,收集时长五分钟。
1 | const profiler = require("v8-profiler-node8"); |
2 | const fs = require("fs"); |
3 | const Bluebird = require("bluebird"); |
4 | |
5 | class PackageController extends Controller { |
6 | async cpuProf() { |
7 | console.log("开始收集"); |
8 | // Start Profiling |
9 | profiler.startProfiling("CPU profile"); |
10 | await Bluebird.delay(60000 * 5); |
11 | const profile = profiler.stopProfiling(); |
12 | profile |
13 | .export() |
14 | .pipe(fs.createWriteStream(`cpuprofile-${Date.now()}.cpuprofile`)) |
15 | .on("finish", () => profile.delete()); |
16 | this.ctx.status = 204; |
17 | } |
18 | } |
然后立即用 ab 压测,给服务压力,
1 | ab -t 300 -c 10 -p post.txt -T "application/json" http://localhost:7001/xxx/xxxxx/xxxxxx/xxxxx |
收集完成后,得到一个 cpuProfile 文件,Chrome 自带了分析 CPU profile 日志的工具。打开 Chrome -> 调出开发者工具(DevTools) -> 单击右上角三个点的按钮 -> More tools -> JavaScript Profiler -> Load,加载刚才生成的 cpuprofile 文件。可以直接用 chrome 的性能分析直接读这个文件打开分析。
这里我要推荐一下 speedscope 一个根据 cpuProfile 生成火焰图的工具,他生成的火焰图,更清晰,还有 leftHeavy 模式,直接将 CPU 占用率最高的排在最左边,一目了然,快速的可以定位到问题。
三、根据火焰图解决问题
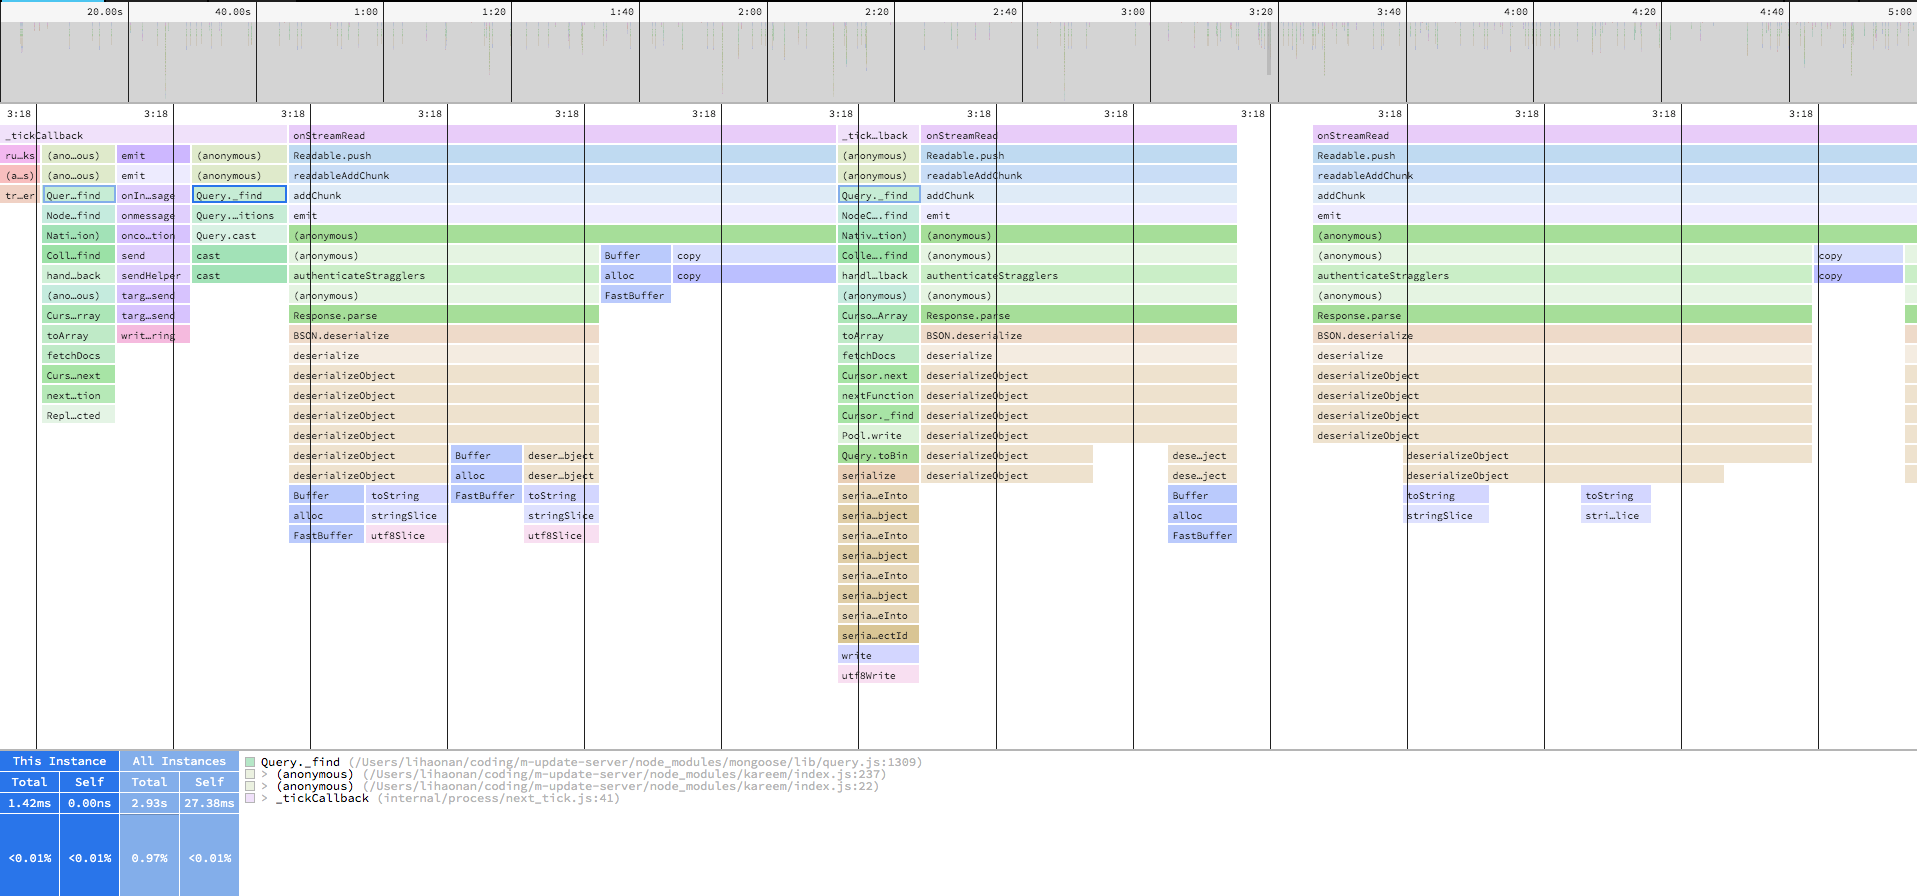
下面是该火焰图的 leftHeavy 模式
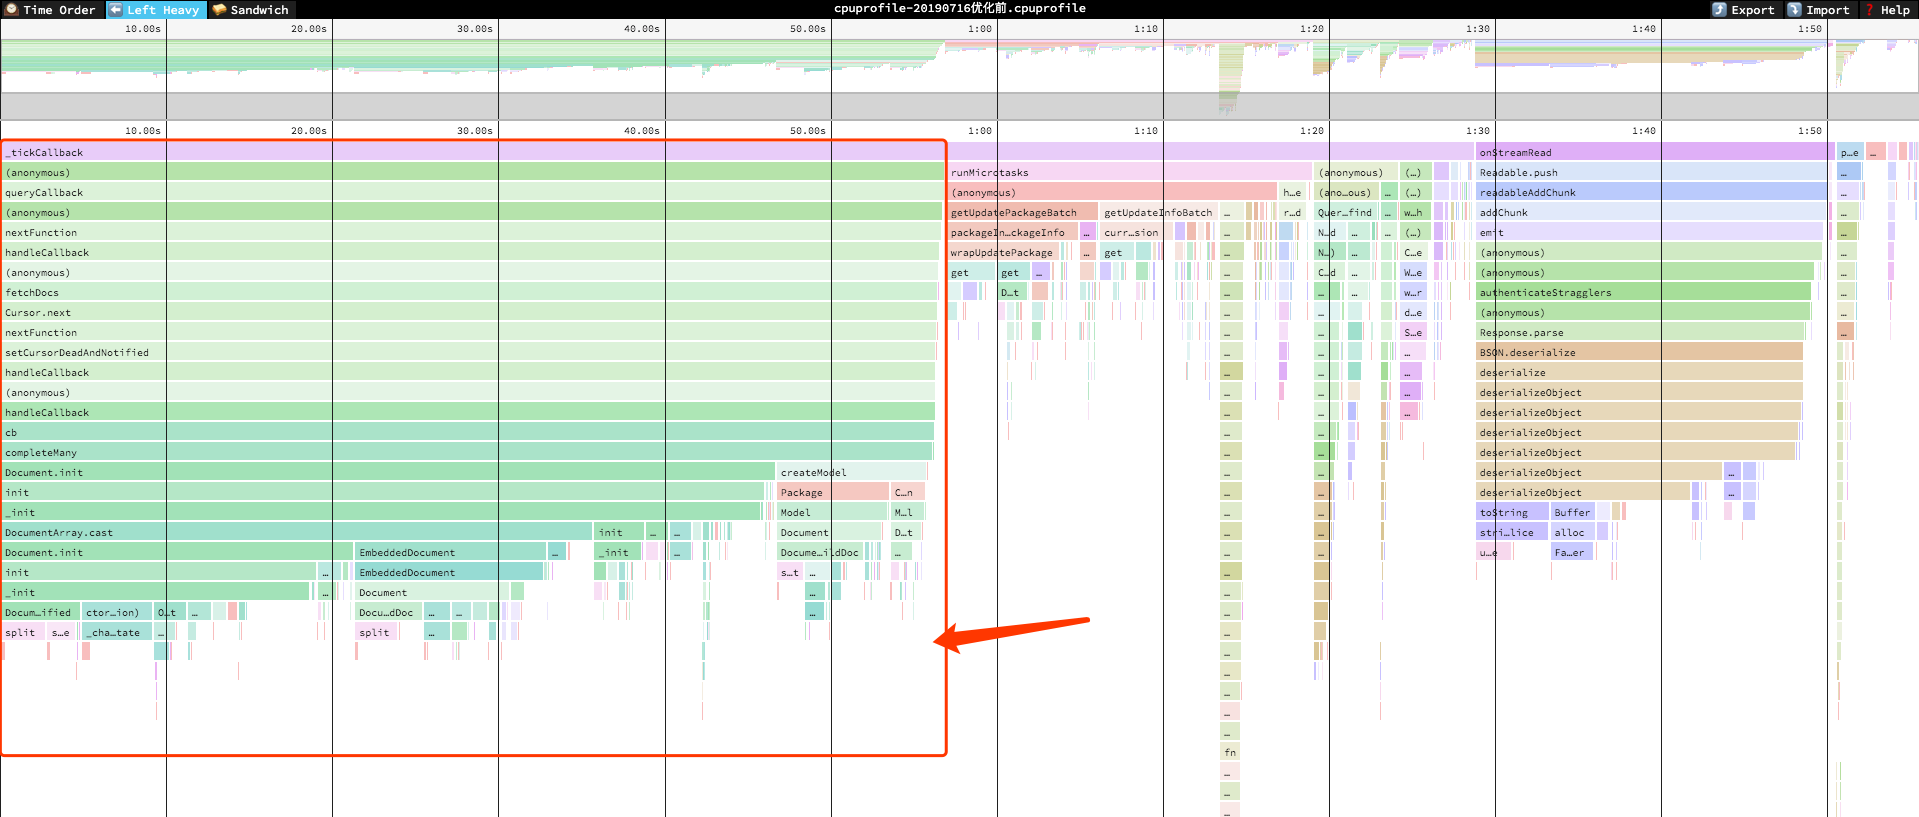
看火焰图的时候越图形越尖说明越正常,横条越长说明占用时间越长,从图中可以看到压测的五分钟里,CPU 占用时间长达两分钟,其中绝大多数被红框中占据,来张大图
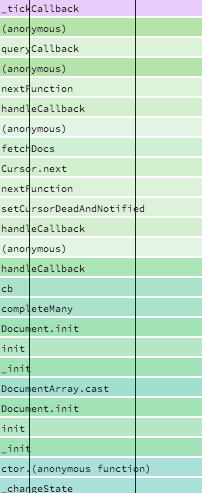
这个火焰图中是由上至下的调用顺序,一眼看过去没有我业务代码中出现的内容,再仔细一看,fetchDocs、Cursor.next、completeMany、Document.init 这好像是 mongo 的东西呀,开心的像个傻子,赶快去搜源码。
从 completeMany 这里破案了,这是 mongoose 中的一个方法,作用是将查询到的结果进行包装,使结果中的每一个文档成为 mongoose 文档,使之可以继续使用 mongoose 提供的方法。如下相关源码。
1 | /*! |
2 | * hydrates many documents |
3 | * |
4 | * @param {Model} model |
5 | * @param {Array} docs |
6 | * @param {Object} fields |
7 | * @param {Query} self |
8 | * @param {Array} [pop] array of paths used in population |
9 | * @param {Function} callback |
10 | */ |
11 | function completeMany(model, docs, fields, userProvidedFields, pop, callback) { |
12 | var arr = []; |
13 | var count = docs.length; |
14 | var len = count; |
15 | var opts = pop ? { populated: pop } : undefined; |
16 | var error = null; |
17 | function init(_error) { |
18 | if (error != null) { |
19 | return; |
20 | } |
21 | if (_error != null) { |
22 | error = _error; |
23 | return callback(error); |
24 | } |
25 | --count || callback(null, arr); |
26 | } |
27 | for (var i = 0; i < len; ++i) { |
28 | arr[i] = helpers.createModel(model, docs[i], fields, userProvidedFields); |
29 | arr[i].init(docs[i], opts, init); |
30 | } |
31 | } |
completeMany 方法会将传入的每一个 docs 通过 helpers.createModel 变成一个 mongoose Document,我们再来看一下是哪里调用的 completeMany 方法,发现在 find 方法中会判断 options.lean 是否等于 true 如果不等于 true 才会去调用 completeMany 方法去包装查询结果。
1 | /** |
2 | * Thunk around find() |
3 | * |
4 | * @param {Function} [callback] |
5 | * @return {Query} this |
6 | * @api private |
7 | */ |
8 | Query.prototype._find = function(callback) { |
9 | this._castConditions(); |
10 | if (this.error() != null) { |
11 | callback(this.error()); |
12 | return this; |
13 | } |
14 | this._applyPaths(); |
15 | this._fields = this._castFields(this._fields); |
16 | var fields = this._fieldsForExec(); |
17 | var options = this._mongooseOptions; |
18 | var _this = this; |
19 | var userProvidedFields = _this._userProvidedFields || {}; |
20 | var cb = function(err, docs) { |
21 | if (err) { |
22 | return callback(err); |
23 | } |
24 | if (docs.length === 0) { |
25 | return callback(null, docs); |
26 | } |
27 | if (!options.populate) { |
28 | // 看这里 重点重点! |
29 | return !!options.lean === true |
30 | ? callback(null, docs) |
31 | : completeMany( |
32 | _this.model, |
33 | docs, |
34 | fields, |
35 | userProvidedFields, |
36 | null, |
37 | callback |
38 | ); |
39 | } |
40 | var pop = helpers.preparePopulationOptionsMQ(_this, options); |
41 | pop.__noPromise = true; |
42 | _this.model.populate(docs, pop, function(err, docs) { |
43 | if (err) return callback(err); |
44 | return !!options.lean === true |
45 | ? callback(null, docs) |
46 | : completeMany( |
47 | _this.model, |
48 | docs, |
49 | fields, |
50 | userProvidedFields, |
51 | pop, |
52 | callback |
53 | ); |
54 | }); |
55 | }; |
56 | return Query.base.find.call(this, {}, cb); |
57 | }; |
去文档上搜一下 lean mongoose query lean 文档上说了如果使用了 lean 那么查询返回的将是一个 javascript objects, not Mongoose Documents 。原话如下。
Documents returned from queries with theleanoption enabled are plain javascript objects, not Mongoose Documents . They have nosavemethod, getters/setters, virtuals, or other Mongoose features.
在文档中还提到了,lean 精简模式,对于高性能只读的情况是非常有用的。
四、后续优化
回到问题上来,看到 mongoose Document 的问题,7 月 2 号到 7 月 3 号后,为什么会突然导致 CPU 暴涨恍然大悟,自己之前 review
代码,看着代码没问题,但是忽略了这一个版本因为业务调整导致查询压力大大增加,可能是过去的好几倍这个问题。随即将查询改成精简模式。只需要如下很简单的几处修改即可。
1 | await model.Package.find(query).lean(); |
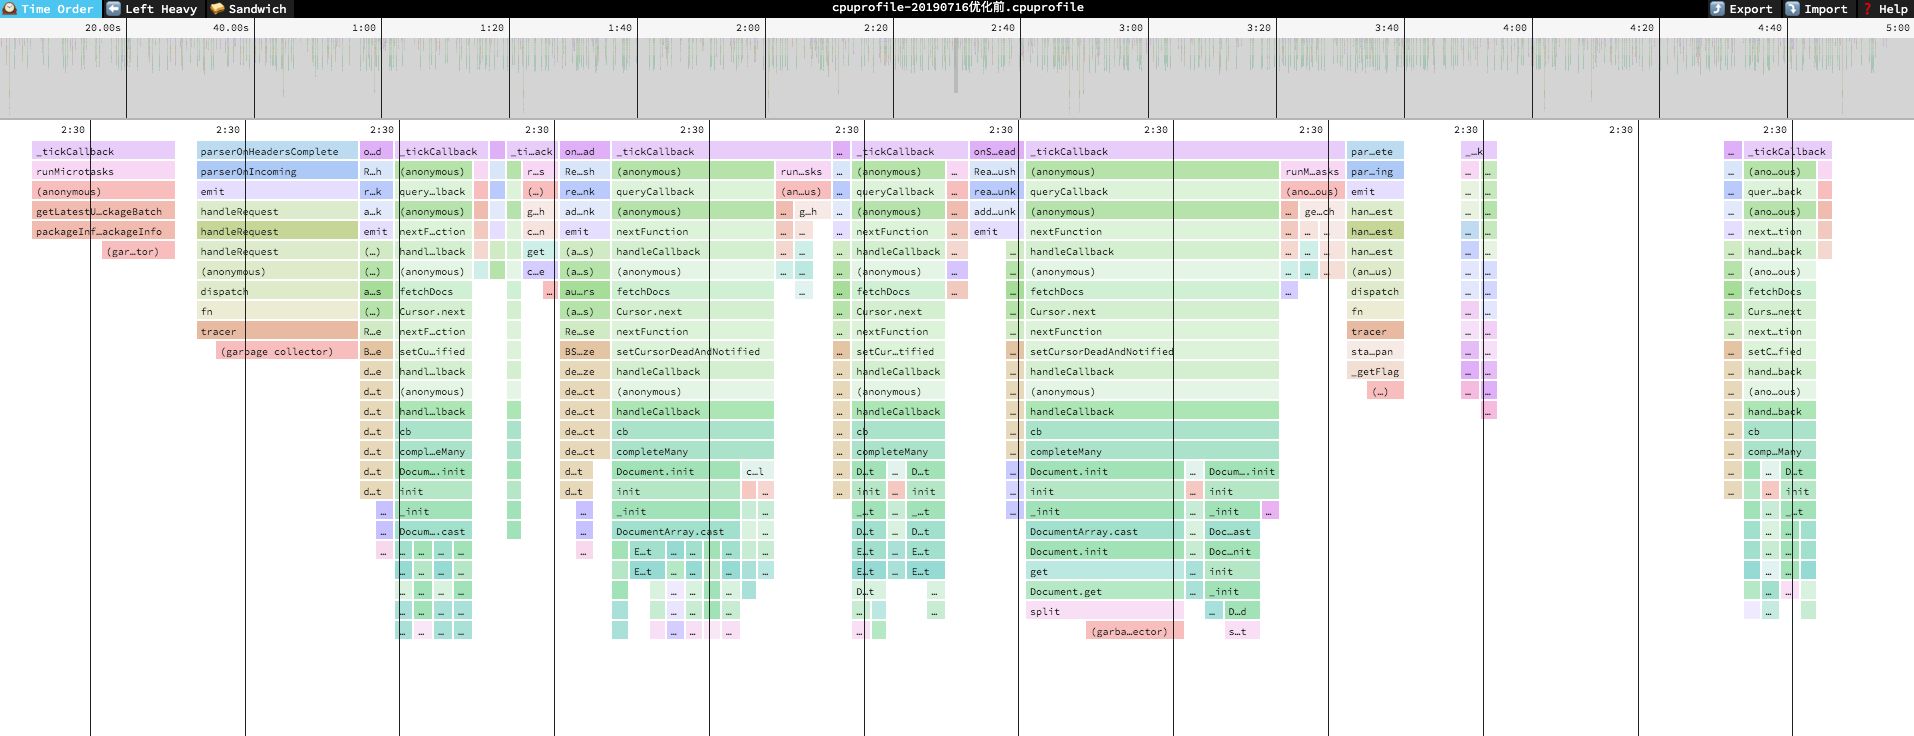
那说到频繁的处理 mongoose Document 导致的性能问题,那其实还有一个优化点可以做,其实在查询的时候多多使用 find 的第二个参数 projection 去投影所需要返回的键,需要用什么就投影什么,不要一股脑把所有的键值一起返回了。处理完这一系列,重写在本地进行了一次同样的压测五分钟,出了一份火焰图,下面图 1 就是这五分钟期间的火焰图,图二就是经过 speedscope 解析过后的 leftHeavy 图,直接观察重灾区。

从图一的火焰图中,并不能看出明显的区别,但是一看到图二就知道我们的优化是有效果的,从最直观的,原本左侧红框中 completeMany 的部分直接没有了,然后 cpu 占用的总时长也由原本的接近两分钟直接降到了 36s,优化效果还是十分明显的。上线观察几天看看效果
如图可以看到,cpu 使用率在优化后得到了大大提升,并且稳定在了百分之十五以内。问题解决了,一切皆大欢喜,服务器降配一切回到正常。但这次故障也让我对诸如 mongoos 这样的 ODM 在使用时需要更加小心谨慎,他给我们带来了无限的便利的同时,可能也会因为一些额外的操作,让我们的服务承受额外的负担,正常情况下这一点性能差距不易察觉,然而到了高峰期,或者大型活动的时侯,可能就会因为这一点小坑,对服务造成更大的影响。
谨记。